Mapping Equity in Los Angeles County
Los Angeles County is strengthening its commitment to data transparency and equity-centered decision-making.
On July 13, 2021, the Los Angeles County Board of Supervisors adopted a motion to guide the equitable implementation of the American Rescue Plan Act and strengthen the County’s equity data and accountability infrastructure. A key component of the motion directed the County’s Anti-Racism, Diversity, and Inclusion (ARDI) Initiative to develop tools to better understand community need and support equitable investment decisions.
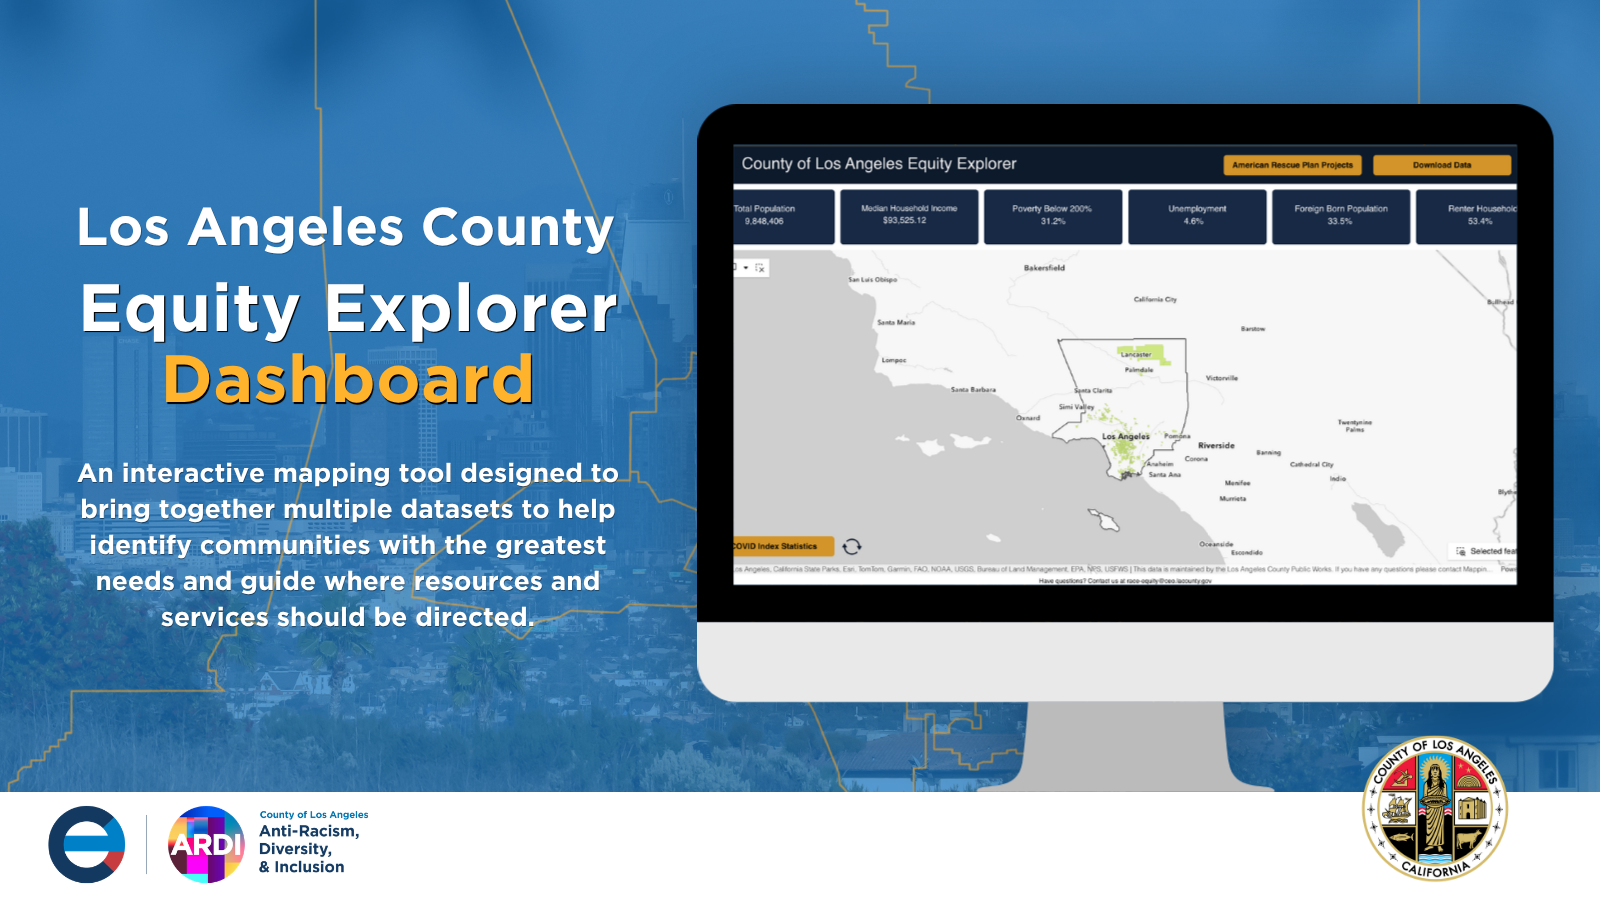
In response, the County developed the Equity Explorer, an interactive mapping tool designed to bring together multiple datasets to help identify communities with the greatest needs and guide where resources and services should be directed.
Over time, the County recognized that traditional data systems alone do not fully capture all communities. Many populations are not geographically concentrated and are often underrepresented in standard data collection and mapping approaches. This makes it difficult to fully understand their needs or ensure they are reflected in planning and investment decisions.
To address this gap, ARDI commissioned the Participatory Mapping Study to better understand these communities and how they experience and access services across Los Angeles County. Through this process, community members identified places of congregation, trusted spaces, service gaps, and barriers to access. The study also provided insight into how to better engage and serve communities that are often overlooked in traditional datasets.
What is Participatory Mapping
Participatory mapping is a community-centered approach to data collection that captures how people actually live, move, and access services. Instead of relying only on traditional datasets, it engages residents directly to map trusted spaces, service access points, barriers, and everyday experiences.
This approach ensures that data reflects lived experience, not just geography. It makes visible the realities of communities that are often overlooked in place-based data systems, particularly those that are dispersed across a region rather than concentrated in one location.
Participatory mapping helps shift data from being purely technical to being more human-centered, inclusive, and actionable.
The County intentionally mapped what communities shared about where they gather and access services, and then applied those findings back onto the Equity Explorer to create new layers that reflect these realities.
Through workshops, surveys, and partnerships with trusted community-based organizations, the study engaged hundreds of residents to document how they navigate the County, where they gather, and the barriers they face.
The data collected through this process was digitized, analyzed using GIS tools, and integrated into the County’s Equity Explorer platform that now includes participatory mapping layers alongside traditional data. These layers provide a more complete picture of community needs by combining quantitative data with lived experience.
The Equity Explorer brings together traditional datasets and community knowledge to help policymakers, researchers, and community organizations better understand where resources are needed most.
Key Findings of the Participatory Mapping Study
The study revealed consistent patterns across communities that are often missed in traditional data: