State of Black Los Angeles County Report
In 2023, the County of Los Angeles released its inaugural report on the State of Black Los Angeles. This report served as one of the County’s recent efforts to highlight the importance of addressing structural racism in Los Angeles County since the Board of Supervisors’ July 21, 2020 motion declaring racism as a matter of public health.
Since then, numerous shifts within the larger social and political landscape have raised concern about the viability of new and existing efforts across the country to address racial disparities as well as the direction in which our society is headed when it comes to ensuring access and opportunity for people from marginalized groups.
In the second installment of this report, we not only pay attention to the unique challenges that shape Black residents’ quality of life in Los Angeles County, we also explore the availability of County services aimed at addressing these challenges. In addition, we explore how the aforementioned evolving political context will shape Black people’s experiences in years to come, as well as the lingering effects of COVID-19 on Black communities. Finally, we have expanded the scope of the report to cover additional areas that shape Black people’s health and well-being, including Black child and youth development, the built environment, and civic engagement. These new domains and indicators, along with those featured in the inaugural report, allow us to paint a more comprehensive picture of the many issues that impact Black people across the life course. We conclude the report with recommendations and next steps regarding how the County can go about improving the quality of life for Black people throughout the region.
Learn more about the policy decisions of the past that have created many of the inequities we see today and the Los Angeles Countywide Racial Equity Strategic Plan for how to make LA County a place where all residents are healthy, experience justice, and thrive. To read more about the Countywide Racial Equity Strategic Plan, visit our page by clicking here.
Companion Piece

In this companion piece to the full State of Black Los Angeles County Report, we (1) outline the key objectives of the report, (2) explain why this report is necessary, (3) present report highlights and key findings, and (4) provide guidance on how to navigate the report. Click the button below to view the companion piece or continue scrolling to learn more and view the full report.
2025 Update: Trends Analysis
This 2025 Update: Trends Analysis builds on the full report, comparing year-over-year indicators across critical domains to reveal where conditions for Black Angelenos have improved, where disparities persist, and where urgent policy attention is needed. Click the button below to view the 2025 Update: Trends Analysis of the State of Black Los Angeles County report.
Report Launch Event
On October 10, 2024, in partnership with the Los Angeles Urban League (LAUL), ARDI shares the 2023-2025 State of Black Los Angeles County Report. Joined by the Los Angeles City Mayor, US Cabinet members, congressional members, and other elected officials and dignitaries, it was an event full of insightful discussions regarding housing/homelessness, health access and equity, and economic empowerment endeavors. Watch the recap video and view the companion piece and full report below.
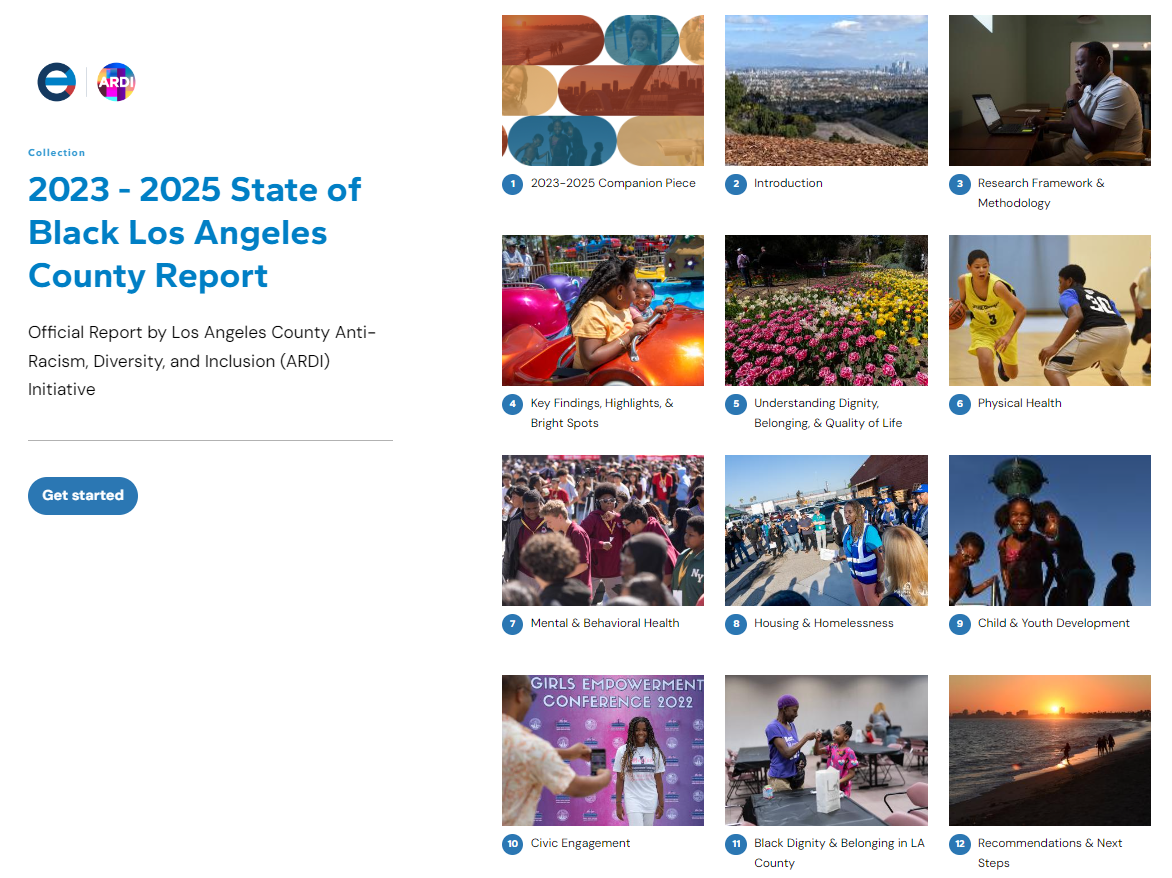
Full Digital Report
How to Navigate the Report
In this second iteration of this report, we take a more person-centered approach to the study of how Black people are faring in LA County, starting with the premise that all people—including Black people—need and are deserving of dignity, belonging, and a satisfying quality of life. We also examine how Black people in LA County are faring at different life stages and within the larger social, political, and historical context of a racially discriminatory society in which policies, programs, social structures, and institutions are shaped by anti-Black racism. Hence, our primary research question for this report is:
- What factors or experiences reduce or negatively impact Black people’s quality of life, dignity, and sense of belonging in Los Angeles County across the life course?
Second, in an effort to inform residents about existing County services and provide tools for residents and other stakeholders unaware about the work the County is already doing to address many of the challenges we identify in this report, our secondary research question is:
- Which existing County programs and services address these challenges?
Taking what we learned from experts, community leaders, community members, County department staff, local advocates, and providers, we have expanded the report’s domains to include three new domains alongside the six original report domains. In the following order, we cover the below nine domains in the report:
- Physical Health
- Mental and Behavioral Health
- Income and Economic Opportunity
- Housing and Homelessness
- Black Child and Youth Development – *new*
- Education
- Built Environment – *new*
- Safety and Justice
- Civic Engagement – *new*
Throughout the report, we combine census, survey, interview, focus group, listening session, and geospatial data, including over 100 metrics and dozens of drivers and root causes, to assess how Black people are faring in the county. We then conclude our study with an analysis of Black Angelenos’ political participation and community practices (Chapter 13: Civic Engagement), capturing Kayla Reed’s sentiment that “We don’t [protest and advocate for our communities] because we hate the police. We [protest and advocate for our communities] because we love each other.”[1] In our concluding chapter (Chapter 15: Conclusion), we summarize the report, with particular attention to how Black people’s outcomes and lived experiences have shaped their sense of belonging in LA County.
This year, we also incorporate the input, insights, and lived experiences of a diverse group of Black people who live and serve in the County, including people who are men, women, non-binary or gender non-conforming, straight, queer, middle-aged adults, older adults, young adults, youth, subject matter experts, community advocates, college students, elected officials, working professionals, retirees, and more. These individuals participated in one-on-one interviews, focus groups, and youth listening sessions held between 2023 and 2024. We also include survey responses from the 2024 Annual Angeleno Opinion Poll which included questions on belonging, which issues concerned survey respondents the most, and their stance on recent local and national events.
[1] Kayla Reed, Executive Director of Action St. Louis in Folayan, S., & Davis, D. (2017). Whose Streets. Documentary, nd Sundance Film Festival, 10.
Digital Storytelling
To enhance the user experience of reading this comprehensive report, we chose a web-based application called ArcGIS StoryMaps, which allows users to explore maps alongside narrative text and other multimedia content. As a result, this online report also serves as a multifaceted tool that allows stakeholders—including residents, community advocates, and service providers—to visualize the geographical areas where Black residents are most impacted and by which challenges.
LA County Inventory of Services
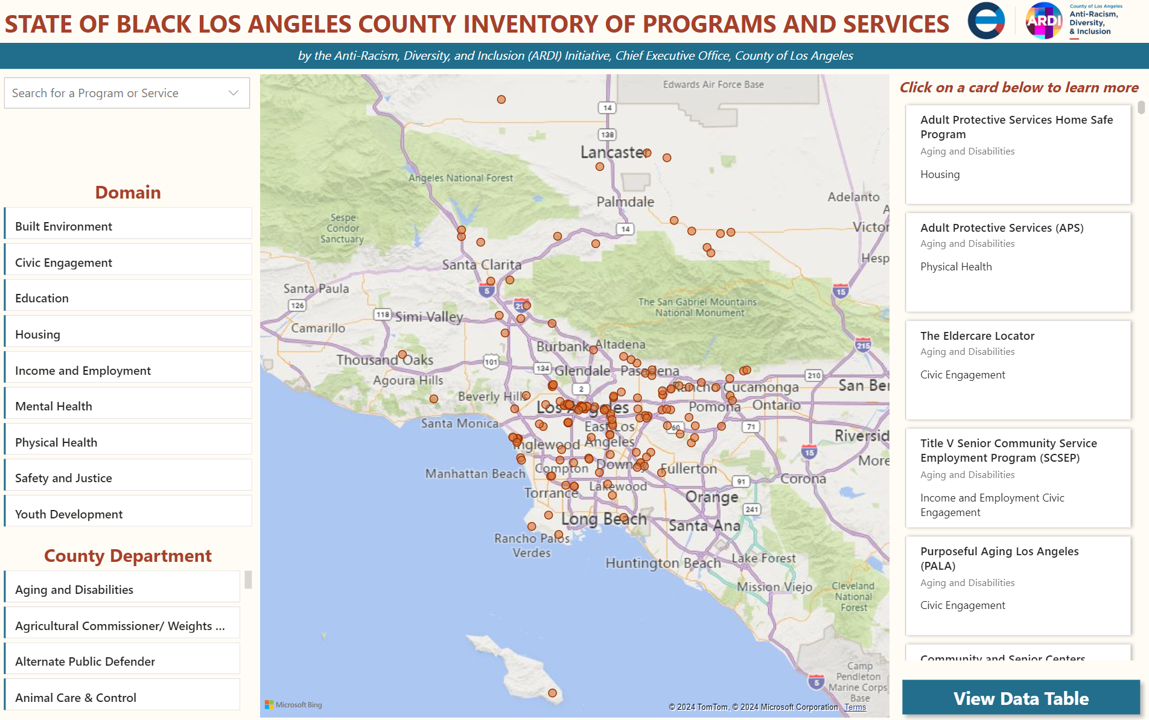
Click the screenshot or button to visit the report’s inventory of County services by domain and location.
In addition to our new 3D maps, another new report feature includes an inventory of available County services by domain and location. Upon choosing a domain—i.e., physical health, education, safety and justice, etc.— users will see a list of all the related County services available across the County’s 38 departments. Residents can also use the finder to locate the County offices closest to them.
DISCLAIMER: The content of this guide is for information purposes only. The content is not intended to be and should not be considered legal or professional advice, nor substitute for obtaining such advice. The user bears all risks related to the use of this information, which is presented “as-is” without warranty or indemnity of any kind. The information presented here may or may not reflect the most current procedures and should not be solely relied upon to make decisions of a substantive nature.
Summary
In the report, we find that when compared to other racial groups in the County, Black people in Los Angeles County continue to experience some of the most adverse outcomes on indicators across multiple domains. However, by expanding the scope of the quality of life measures we examine, we uncover areas in which Black Angelenos have promising outcomes on certain indicators, particularly on indicators that are typically difficult to measure. More importantly, we conclude that even in the face of adverse outcomes, Black Angelenos remain resilient, engaged, deeply invested in their communities, and, to some extent, optimistic about the possibilities in front of them. However, as we point out in the report, these efforts are not a substitute for government action. The County of Los Angeles must remain committed to implementing policies and programs that uphold all residents’ dignity, foster belonging, and ensure all residents are given the opportunity to have a good quality of life.

Next Steps
ARDI will collaborate with County departments to integrate and implement recommendations through existing County efforts. This will also require strengthening workforce capacity to provide culturally appropriate, trauma-informed, and healing centered approaches to service delivery and increasing communication, outreach, and promotion efforts to increase awareness of County resources. To maintain accountability, ARDI will also track investments, assess impact on desired outcomes, and publicly report on progress.
Conclusion
Though our inaugural report served as a comprehensive, baseline report on how Black people are faring in LA County, this year’s report provides a more panoramic view of the Black community, including areas of well-being that are more difficult to measure. Also, by contextualizing these outcomes within the broader social, political, and cultural environment, we are better able to convey the importance and magnitude of racial disparities in the County and identify the appropriate institutional levers and policy solutions needed. We hope that this report will not only better inform residents and other stakeholders about Black people’s lived experiences in Los Angeles County, we hope that it encourages Angelenos from various sectors—private, non-profit, philanthropy, city government, etc.—to partner with the County and help eliminate these disparities, as well as enable us to better align County services with the most vulnerable residents’ health, economic, and social needs.